Building SixFifty's Election Tracker
One of my most visited webpages of 2016 was FiveThirtyEight’s 2016 Election Forecast, a habit apparently shared by many of us at SixFifty HQ. Even our name, primarily a reference to the 650 constituency seats being contested in the UK general election on June 8th, is a deferential nod to FiveThirtyEight. There’s something surprisingly addictive in seeing how the latest news story might impact the polls one way or another during an election campaign.
For anyone familiar with psychology or growth hacking, an election tracker is quintessential Habit Forming 101:
- The Cue. A news story acts as a “cue”, prompting you to wonder whether your favoured candidate is now more or less likely to win as a result.
- The Routine. Checking your favourite poll trackers is simple & quick.
- The Reward. Seeing an uptick in your preferred candidate’s poll ratings is like watching the future changing before your eyes. Sometimes you win, sometimes you lose, but just like with gambling the unpredictability only makes the addictive effect more powerful. In the words of Nir Eyal, author of Hooked: How To Build Habit Forming Products, “predictable feedback loops don’t create desire”.
In short, building a poll tracker was a big priority for us, but it wasn’t quite as simple as plugging a Javascript visualisation library into an API for polling data…
Polling data isn’t very open
There are many good repositories for open data in the UK:
- The Open Data Institute, founded by Sir Tim Berners-Lee, has a wealth of information on finding and working with open data.
- data.gov.uk has a fantastic assortment of government-related data including election results, polling stations and so on.
- Regional efforts like The London Datastore exemplify what’s possible when open data policies are implemented, such as the “open by default” guidelines championed by the new UK Digital Strategy.
- The crowd-sourced Google Doc of “Useful UK Politics Datasets” curated by Newspeak House (the SixFifty team has made some contributions too!) is a treasure trove of open data, containing datasets for everything from candidates’ CVs and party manifestos to campaign expenses and constituency-level demographic data.
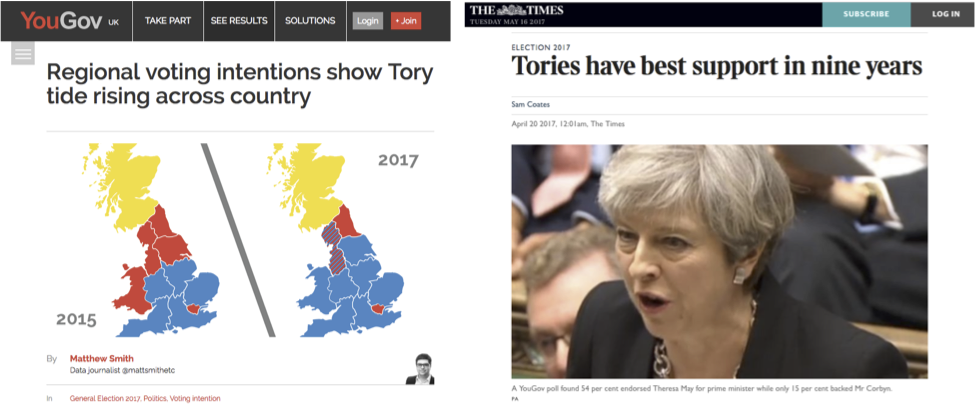
Unfortunately, opinion polls are conducted by commercial polling firms and are not quite so open (read our series of explainer articles for more information on how polling works in the UK). For example, if The Times commissions YouGov to conduct a survey on voting intention across Britain, this data is released in several ways.
The headline results are compiled, analysed and released as articles by both the publisher as well as the polling firm.
 Source:
 The “raw data” is released as a set of “tables”, usually either a PDF or Excel spreadsheet containing various breakdowns of each question in the survey. Election polling usually includes a number of questions such as:
- “Voting Intention” (e.g. “Which party will you be voting for on June 8th?”)
- Party leader satisfaction
- Policy preferences (e.g. “Do you think tuition fees should be abolished?”)
- Demographic background (location, gender, age, education, social grade)
- Voted during EU Referendum? Remain or Leave?
- Voted during 2015 general election? Which party voted for?
- Questions designed to gauge likelihood of voting – overestimating Labour supporters’ likelihood of voting was a major contributor to the polling failures in 2015.
This is what “raw” polling data looks like (source):
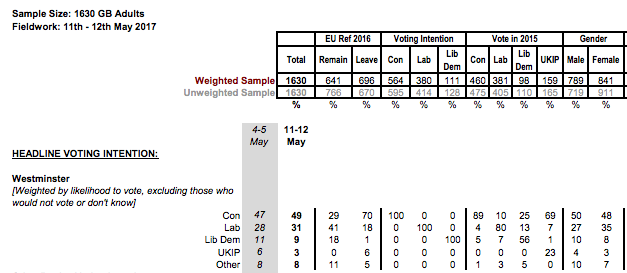
Even if liberating this data from their PDF prisons was possible to automate (we gave it a decent shot, big shoutout to Tabula for doing the heavy lifting), it wouldn’t necessarily be the best use of our time. So we looked elsewhere to see who else might be doing this already.
Political analysts are great at making data talk, less great at making data open
We evaluated a range of sources for polling data. These were our minimum requirements:
- Updated regularly. A poll tracker has to be up-to-date, which means the data source should be updated within hours of a new poll being released.
- Easily accessible. A manually updated HTML table is easy enough to scrape but may have inconsistent data formatting. Either a static CSV/JSON file or an open API would make it easier to pipe the data into our poll tracker.
- Polling methodology. What was the sample size and margin of error? Was it an online poll or phone-based survey? These details aren’t required for building a poll tracker, but they can be extremely useful in constructing a good forecast model.
- Raw data. Providing links to the raw data source (in this case, the PDF tables provided by polling companies) is simply good practice.
We also had some “nice-to-have” requirements for sources of polling data:
- Includes all major parties. Most poll trackers have voting intention for the Big Three parties at a national level. Some might include SNP, but an ideal tracker would include SNP (both at regional/national levels), Plaid Cymru (at regional level) and Northern Ireland polling too.
- Goes beyond national voting intention. Election polling gets very detailed. The tables cover regional and demographic breakdowns, plus other questions that dig into policy preferences and leadership ratings. We want to open this data up, use it for our analyses and enable other people to use it too.
- Includes undecided voters. Almost all poll trackers report voting intention excluding undecided voters. In 2015 many left-leaning undecided voters simply didn’t vote, whereas the right-leaning undecided voters tended to go out and vote Conservative on election day. This means that in 2017 undecided voters are now excluded with a bias towards the Tories. This bias might indeed result in more accurate polling come June 8th, but until then it’s worth bearing in mind that around 30% of the population are currently undecided voters. Our ideal data source would include both figures: the headline figures as reported in newspapers, and data that includes the percentage of undecided voters.
We evaluated several aggregators of polling data against this criteria: OpinionBee by Andy Hartley, the HuffPost Pollster by Huffington Post / Pollster, the incredible PollBase by Mark Pack, Britain Elects by Ben Walker, Electoral Calculus by Martin Baxter and the UK Polling Report by Anthony Wells.
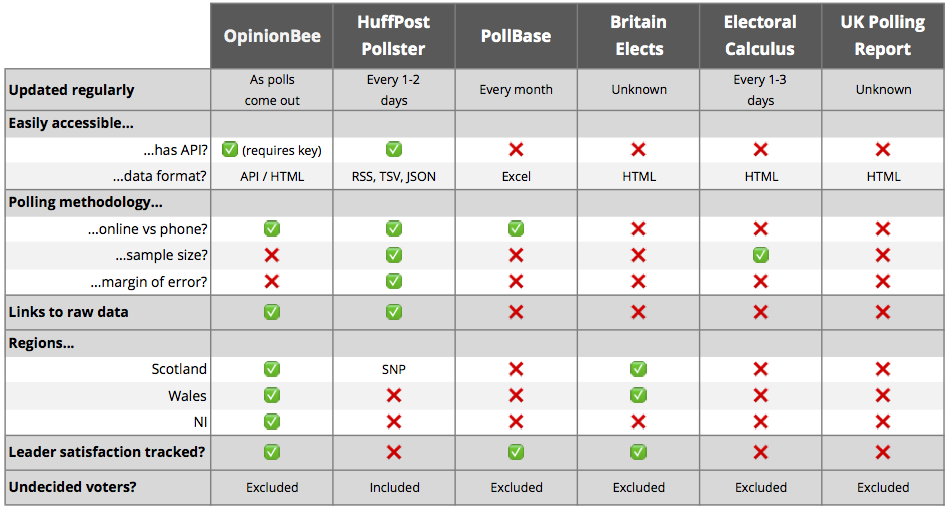
Nothing quite satisfies even our minimum requirements. OpinionBee comes very close with quick turnarounds and easily accessible data (including links to the raw tables) but falls down on providing some of the additional information we were looking for. HuffPost Pollster only provides unweighted data (i.e. including undecided voters) and has slightly slower turnarounds. PollBase is an amazing resource (it has polls going back to 1943!) but updates are less frequent.
One of SixFifty’s goals is to contribute to the reservoir of open political data if we find there’s a genuine unmet need. Polling data seems to fall into this category, so we built our own open polling data pipeline.
Alert, update, automate
“Simple but effective” is our guiding principle here. We’re hitting as many of our stated requirements as possible using a fast process that also avoids creating any backend infrastructure:
-
Alert. We plugged RSS feeds from several of the above data sources into a dedicated Slack channel.
-
Update. The moment a new poll is announced, we source the raw data tables and add it to a SixFifty-curated Google Doc of recent polls. A simple Python script pulls the data from the Google Doc, exports it into a variety of formats, generates new datasets with some basic “poll-of-polls” LOWESS smoothing applied, and uploads the lot to an S3 bucket.
-
Automate. The entire process takes <2 minutes, but if there’s any way we can automatically extract the full polling tables and upload them too, we will. It’s on our todo list.
We’ve chosen to release our datasets in JSON, CSV and Feather formats as we believe a good open data portal should make it as easy as possible to import data into your tool of choice. If you don’t know Feather, it’s a next-gen file format resulting from a collaboration between pandas’ creator Wes McKinney and R mega-guru Hadley Wickham that preserves dataframe metadata (saving a good few lines of type coercion), optimises read/write/storage and ultimately improves interoperability between R and pandas.
Data dictionaries for all our published datasets1 are detailed on our GitHub including links to both the raw polling data (CSV, JSON, Feather) and the smoothed data (CSV, JSON, Feather). If you want to take this data and build your own poll tracker, that would honestly make us quite happy. Or you could contribute to improving ours.
The frontend
My initial “quick & dirty” approach was to use R’s ggplot2 to generate a static image in a variety of web-friendly sizes and push them to S3. As with everything we do, the code for this is on GitHub.
Meanwhile, our frontend guru Dan Palmer was looking into options for rendering an interactive poll tracker in the browser. We considered using Victory, a collection of React.js components for building interactive data visualisations, but in the end opted for stock D3.js.
The rationale here is that SixFifty, like many open source projects, is composed of many volunteers contributing their time intermittently. Our engineering approach is more of a relay race than a solo marathon. Sticking to commonly used tools and libraries makes it easier for someone else to pick up the baton and run with it.
As long as you’re familiar with React and D3, you should be able to adapt our code and rework the poll tracker for any election. If you feel like turning it into a reusable component and open sourcing it in its own right, get in touch, we’d love to help!
Follow SixFifty on Twitter, Facebook, Medium or Instagram for updates and commentary whenever a new election poll is released. If you’re as addicted to tracking elections as we are, you could even bookmark or pin2 SixFifty to your browser until June 8th.
Two new polls released today suggest the recent Labour surge is real, taking votes from Conservatives & UKIP #GE2017 https://t.co/wplP0e55yF pic.twitter.com/S7ZhRSA9Ke
— SixFifty (@SixFiftyData) May 21, 2017
-
We try hard to ensure all of the clean model-ready datasets we republish have the relevant open data licence or attribution statement clearly listed. To the extent that we could determine, polling tables can be republished with attribution. Please contact us if this is not true. If you are a publisher of polling data, we would love for you to help enable open data sharing by clearly stating an easily discoverable data licence on your website. ↩
-
Right click this tab in your browser and select “Pin Tab”. ↩