Creating our data-driven logo
We feel that data allows for better decision making, improves policies, and forces us to be more impartial. When thinking about our logo we wanted to make sure it reflected these same values.
As with many UK electoral trackers, we thought a good starting point was to include the colours of the main parties. To many who are interested in politics these are instantly recognisable and help to convey what we’re trying to achieve.
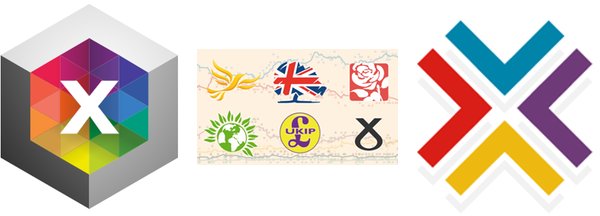 BBC and FT election trackers, and the Britain Elects poll aggregator logos
Ideas
We’re not designers, so when it comes to logo design we have no idea what we’re doing. A colourful circle felt like a good starting point.
Then, being the sort of data-driven enthusiasts who model elections in their spare time, we wondered – what if the logo changed based on the current polling data?
We mocked up what it would look like for the current polls, and this was the result…
With the colours, it fits well with the other election trackers, and with the addition of the data and the fact that the logo will change over time, we feel this represents us.
Implementation
To make this a reality we needed it to be easy to update, so we decided to create the logo with React and have it render in the browser based on dynamic data. Rendering in the browser isn’t ideal for something that only changes on a daily basis, but as we don’t have a server-side component to our stack it didn’t feel worth adding one just to support this, plus React is pretty fast.
Once we had a simple component up and running, the next step was connecting it to the DOM so that we could easily include it anywhere on the site. To do this we used Reactive Elements, a library that makes it easy to convert React components to Web Components.
import 'reactive-elements';
import React from 'react';

class Logo extends React.Component {
  render() {
    return (
      <div className="logo">
        <svg>
            // ...
        </svg>
      </div>
    );
  }
}

document.registerReact('sixfifty-logo', Logo);
Using our component was now as easy as adding this HTML to any page.
<sixfifty-logo
    data='{
        "con":0.45,
        "lab":0.26,
        "ld":0.11,
        "ukip":0.09,
        "grn":0.03
    }'
    colours='{{
        "con":"#0F80D6",
        "lab":"#D20004",
        "ld":"#FEAA09",
        "grn":"#5EC500",
        "ukip":"#5E0D78",
        "snp":"#FFFF00",
        "oth":"#999999"
    }}'
></sixfifty-logo>
The last thing we did was to centralise the data so that it can be updated easily. We use Jekyll to build the site so Jekyll’s data files were a good fit, and now defining the values of the current polls, to be used for the logo and other visualisations throughout the site is as simple as editing a YAML file:
current:
  con: 0.45
  lab: 0.26
  ld: 0.11
  ukip: 0.09
  grn: 0.03
While this is a nice feature on our site, it’s impractical to upload new logos to Twitter and other social-media platforms every day, so for those places that are hard to update we’ve decided to go with the 2015 election data.
Without knowing it, we’ve apparently stumbled across the hottest new thing in brand design: the living logo. Whether it’s Seagate forging their logo from a constantly moving stream of objects stored on Seagate drives, or Google’s new G Dots - “a dynamic and perpetually moving state of the logo” - brands are looking at ways to move beyond a static logo. In our case, this logo will evolve through time along with the nation’s sentiment about who they’ll be voting for on June 8th. We couldn’t think of anything that’s more emblematic of SixFifty’s mission.
You can see this work and more, and contribute to SixFifty on GitHub.